• Skip to primary navigation
  • Skip to main content
  • Skip to primary sidebar

5 Circles Research

  • Overview
  • SurveysAlaCarte
  • Full Service
  • About
  • Pricing Gurus
  • Events
  • Blog
  • Contact

Methodology

Leave a Comment

This survey Hertz: lack of thought

I recently took a survey sponsored by the Hertz Corporation, intended to assess the appeal of several new approaches to services. This post discusses some of the problems I found, and why you should avoid creating your surveys like this one.

After asking about the number of times I had rented a vehicle, for what purpose, what type, and from which company, they asked how important price was to me when deciding which company to rent from the last time.

This is a pretty good question.PriceFactor2

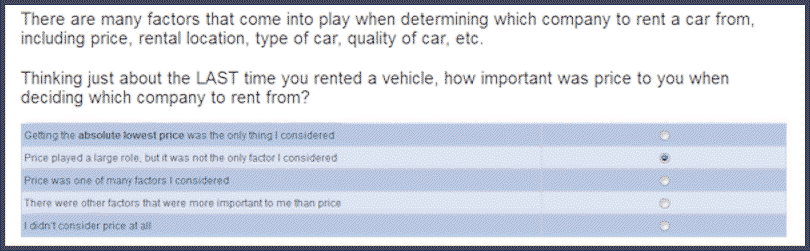
Now they have an anchor for later questions about price. They know how important price was to me for this last rental. Note that the importance of price (or any other factor come to that) is situational, certainly for me. The last car I rented prior to taking the survey was for a vacation on Maui for a family wedding. I didn’t want a fancy car, or at least I didn’t feel like justify one for this trip – the wedding and all the fun things to do on Maui were going to be pretty expensive, and I expected to be driving on some substandard roads. I needed something flexible enough to take other members of the party – I expected people to be juggling activities. So I chose a four-door.

The next section of the survey covered the importance of various features, the mileage, and the condition of the vehicle. One question asked about the importance of general areas such as performance, cleanliness, audio features, fuel efficiency.
FeaturesImportance2

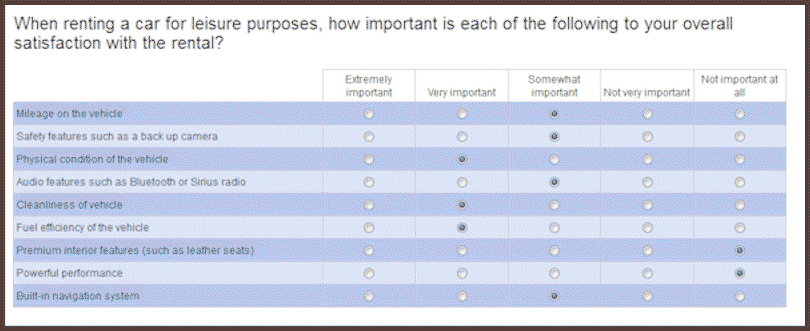
Most of the question options made sense to me, but mileage on the vehicle doesn’t seem like something that should be included in the list. From my perspective, the mileage is going to relate to the physical condition and the cleanliness of the vehicle. When I pick up the rental car the current mileage is just a minor item, and perhaps something to note for the contract, especially if there is a mileage limit on my rental. Perhaps I should be paying more attention, but I don’t remember ever thinking about it as I signed a contract. Perhaps somebody pointed out that this was a low mileage vehicle – I don’t remember. I guess I always expect a fairly low mileage on a rental car, especially from one of the major companies. Anyway, I wasn’t too surprised when I saw the first question that included the importance of mileage, although it struck me as a little odd in the same way I’m describing here. The next question asked me to rank the top three options of the nine that were provided previously; this still made sense.

Things went downhill from here. The next question asked the maximum number of miles of a rental car that I would find acceptable and still be satisfied. Here’s the question:
AcceptableMileage
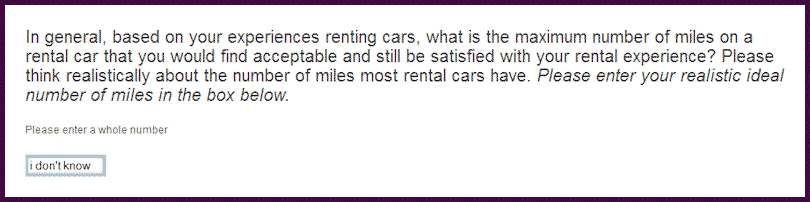
Puzzled as I was by the notion that I could come up with an answer (note that the question text stresses “realistic”), I tried to enter “I don’t know” into the box in the forlorn hope that it would be accepted, despite the fact that the instructions read – please enter a whole number. My attempt generated an error message, repeating the directive, this time in bold red – Please specify a whole number. There was also a red warning at the top of the screen telling me that I needed to follow the instructions. These validation messages weren’t too surprising, but I was disappointed to find that I couldn’t indicate my real feelings. I next tried to enter “0” into the box. This generated a different error message – Sorry, but the value must be at least 100. I think this was the point at which I realized that this survey was going to provide material for an article. Expecting further fun and games, I decided not to waste too much more time on this one question. I entered 10,000 and was allowed to proceed to the next question.

Lesson 1. What’s the worst thing about this little battle with the question? The data they got from me is rubbish. If enough other people are equally uncaring, or like me have no realistic idea of the mileage that would be satisfactory, Hertz is making decisions on a very shaky foundation. Read on, it gets worse.

The introduction to the next section describes what I’ll see next – “…several scenarios – understanding your opinion when renting a vehicle. Please think about what makes a car rental experience enjoyable.” This sounded pretty good, but it turned out that they just wanted to torture me on the mileage issue in a different way.
$270_60000
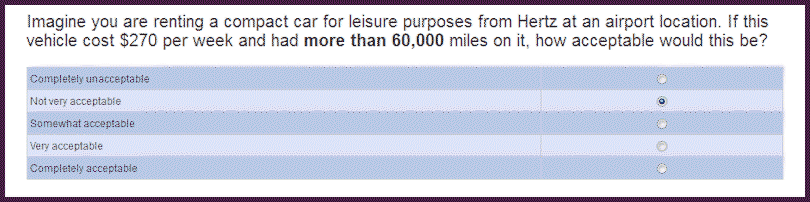
“Uh oh”, went through my mind. “I wonder how they’ll play this out? Are we going to be negotiating on the mileage?” Yes that’s exactly what happened. I responded “Not very acceptable” to the first round of this question. I don’t really know whether it’s acceptable or not, but I’m pretty sure Hertz wants me to believe that it isn’t. I was actually hoping that I would just get a single question on the subject, but that’s not how it worked. The next question was exactly the same wording except that “had more than 60,000 miles on it” was replaced by “had 50,000 miles on it”. There was an additional instruction too – Please note that the question remains the same, but the NUMBER OF MILES ABOVE has changed. Isn’t there some form of torture based on telling the victim what’s going to happen? But now I’m curious and I want to see how long this can go on. 60,000, 50,000, 40,000, 35,000, 25,000, 20,000, 15,000, 10,000. I answered “Not very acceptable” every time. At 5,000 – yes, that’s the ninth repeat – I chose “Somewhat acceptable” and was allowed to move on to the next torture chamber.

Lesson 2. Why doesn’t this repetitive approach work? For one thing, it’s boring. Even if someone has a realistic idea of a good number (perhaps a rental car should be similarly low mileage to the vehicle at home that’s replaced regularly), they still have to go through the performance to reach the acceptable number. And it’s a negotiation – “how low mileage can I get for the same $270?” This is where annoyance and fatigue is going to build up. Bad data, increased likelihood of dropping out, reducing the likelihood of achieving representative results.

Idiosyncratically,

Mike Pritchard


Filed Under: Methodology, Pricing, Surveys

Leave a Comment

Valentine’s Day: think about seasonality and annual trends

Valentine’s Day provides an opportunity for me to suggest that your market research should take into account some bigger picture factors. Whether or not you have a retail product or service, there are lessons to be learned from Valentine’s Day. What are the annual seasonal variations in your business and what are the trends over longer periods? How do trends affect your market research?

256px-Chocolate_gift GVBORI_Diamond_ring_Heart_desgin256 RED_ROSES_4_(2791762442)

Valentine’s Day is well known as the second most important gift giving occasion in the calendar, in the US certainly and for most of the Western world also. But that’s too simplistic. Let’s look at trends of 3 important gift categories. I’m using Google trends to look at search volumes, as an easy way to make a couple of points.

[trends h=”330″ w=”500″ q=”flowers,+chocolate,+jewelry” geo=”US” date=”1/2008+73m”]
The Y axis is the volume of searches, and the X axis is time. We’re concentrating on searching here. [Data from various sources including the National Retail Federation show that flowers are given as gifts about twice as often as jewelry, and candy is more frequently given than flowers.]

Note that Christmas is more important than Valentine’s Day for searches on chocolate. And the same is true of jewelry. Flowers are rarely searched at Christmas, more frequently at Valentine’s Day, but most often for Mother’s Day. Note that these charts are all for the US so the added complexity of different dates for Mother’s Day in different countries has been eliminated.

OK so this is about chocolate, jewelry and flowers – what does it mean for your product or service? Imagine that you are planning a research project to find out which items you should carry in a multiline store. Or that you want to know which services will be most popular. Your results might be thrown off if you conducted the research without factoring in seasonality. Valentine’s Day, and gift giving in general are pretty obvious. So are back to school, outdoor recreation, and many other time-driven factors that might affect your business and your research. What about B2B? You probably need to be aware of budgetary cycles and replacement planning. The point is awareness. Once you know that the factors exist, you can decide if you should adjust research timing (this is rarely realistic), or if you need to modify the survey in other ways such as identifying buying cycles or interest levels in the category, including adjusting the sampling approach. For example, if you’ve just purchased a new car you are more likely to give coherent answers about after-market accessories.

Longer-term trends are a little harder to see from the Google Trends chart because of the big swings each year. But it is clear that the search volume for chocolate has increased over the past few years.

Back to Valentine’s Day. Much of the published research covers expected spending and plans. I’m a planner, so I’m usually ready for the holiday. What about those last minute people who haven’t prepared, or if they think about it at all are expecting to buy some flowers on Valentine’s Day itself? With the severe weather conditions in the Northeast, these people might be out of luck, and their sweethearts will be disappointed. I hope they can order something online – the acknowledgment and an electronic greetings card might have to do.
512px-Cross_Country_Skiing_Belden_Ave_Chicago_Feb_2_2011

Idiosyncratically,

Mike Pritchard


Image sources:

Ring: By GVBORI520 (Own work) [CC-BY-SA-3.0 (http://creativecommons.org/licenses/by-sa/3.0)], via Wikimedia Commons
Chocolate: By Chrys Omori from Sao Paulo, Brazil (Mother’s birthday gift) [CC-BY-2.0 (http://creativecommons.org/licenses/by/2.0)], via Wikimedia Commons
Flowers: By Kaz Andrew from Edmonton,Alberta, Canada (RED ROSES 4 Uploaded by Dolovis) [CC-BY-SA-2.0 (http://creativecommons.org/licenses/by-sa/2.0)], via Wikimedia Commons
Snowy road: Victorgrigas at en.wikipedia [CC0], from Wikimedia Commons

Filed Under: Methodology, Statistics

5 Comments

QR codes not hitting the spot

QR code with question mark

Many marketing people have been promoting the value of QR codes for quite a while. After all, the promise seems obvious – post a targeted code somewhere, make it easy for someone to reach the website, and track the results of different campaigns.

Studies such as this February 2011 survey from Baltimore based agency MGH seem to confirm the positives. 415 smartphone users from a panel were surveyed. 65% had seen a QR code, with a fairly even split between male and female. Of those who’d seen a code, 49% had used one, and 70% say they would be interested in using a QR code (including for the first time). Reasons for the interest include:

  • 87% to get a coupon, discount, or a deal
  • 64% to enter a sweepstake
  • 63% to get additional information
  • 60% to make a purchase

31% say they’d be “Very Likely” to remember an ad with a QR code, and a further 41% say they’d be “Somewhat Likely” to remember.

The published survey results don’t cover whether people actually made purchases, or did anything else once they’d visited the site (32%). But let’s look at what gets in the way of using the QR code in the first place.

The February 2012 of Quirk’s Magazine has a brief article, titled “QR Codes lost on even the savviest“, referencing work done by Archival (a youth marketing agency). The thrust is that if QR codes are to succeed, they should be adopted by college students who are smartphone users. However, although 80% had seen a QR code, and 81% owned a smartphone, only 21% successfully scanned the QR code used as part of the survey, and 75% say they are “Not Likely” to scan a QR code in future. A few more details from the study and a discussion are at http://www.archrival.com/ideas/13/qr-codes-go-to-college. I suspect the Archrival results reflect market reality more than MGH, but in any case QR codes are not living up to expectations. When was the last time you saw someone use a QR code?

Some may place the blame with marketers who don’t do as good as job as they should of communicating the benefits, and indeed having something worthwhile in the landing page. But technology is probably the most important factor. Reasons noted by the students include:

  • Needing to install an app. Why isn’t something pre-installed with more phones?
  • Expecting just to be able to take a picture to activate the QR code. Why shouldn’t this work?
  • Takes too long. Of course, they are right.

To these reasons, I’d add that there is currently some additional confusion caused by the introduction of new types of codes. Does the world need Microsoft Tag and yet another app?

Maybe QR codes will suffer the same fate as some previous technology driven attempts to do something similar. Does anyone remember Digimarc’s MediaBridge from 2000? Did it ever seem like a good idea to scan or photograph an advertisement in a printed page to access a website? What about the RadioShack CueCat? Perhaps Digimarc has a better shot with their new Discover™ service that includes a smartphone app as well as embedded links in content. If you are already a Digimarc customer, or don’t want to sully the beauty of your images with codes – maybe it’s the answer. But that seems like a limited market compared with the potential that’s available for QR codes done right.

Come on technologists and marketers – reduce the friction in the system!

Idiosyncratically,

Mike Pritchard

Filed Under: Methodology, News, Published Studies

Leave a Comment

IT terminology applied to surveys

James Murray is principal of Seattle IT Edge, a strategic consultancy that melds the technology of IT with the business issues that drive IT solutions. When James gave me a list of things that are central for IT professionals, I thought it might be fun (and hopefully useful) to connect these terms with online surveys for market research.

[Warning: if you are a technical type interested in surveys, you might find this interesting. But if you aren’t in that category, I won’t be offended if you stop reading.]

Scalability

The obvious interpretation of scalability for IT applies to online surveys too. Make sure the survey tool you use is capable of handling the current and predicted usage for your online surveys.

  • If you use an SaaS service, such as SurveyGizmo or QuestionPro, does your subscription level allow you to collect enough completed surveys? This isn’t likely to be an issue if you host your own surveys (perhaps with an open-source tool like Lime Survey) as you’ll have your own database.
  • Do you have enough bandwidth to deliver the survey pages, including any images, audio or video that you need? Bandwidth may be more of an issue with self-hosted surveys. Bandwidth might fit more into availability, but in any case think about how your needs may change and whether that would impact your choice of tools.
  • How many invitations can you send out? This applies when you use a list (perhaps a customer list or CRM database), but isn’t going to matter when you use an online panel or other invitation method. There are benefits to sending invitations through a survey service (including easy tracking for reminders), but there may be a limit on the number of invitations you can send out per month, depending on your subscription level. You can use a separate mailing service (iContact for example), and some are closely integrated with the survey tool. Perhaps the owner of the customer list wants to send out the invitations, in which case the volume is their concern but you’ll have to worry about integration. Most market researchers should be concentrating on the survey, so setting up their own mail server isn’t the right approach; leave it to the specialists to worry about blacklisting and SPF records.
  • Do you have enough staff (in your company or your vendors) to build and support your surveys? That’s one reason why 5 Circles Research uses survey services for most of our work. Dedicated (in both senses) support teams make sure we can deliver on time, and we know that they’ll increase staff as needed.

Perhaps it’s a stretch, but I’d also like to mention scales for research. Should you use a 5-point, 7-point, 10-point or 11-point scale? Are the scales fully anchored (definitely disagree, somewhat disagree, neutral, somewhat agree, definitely agree)? Or do you just anchor the end points? IT professionals are numbers oriented, so this is just a reminder to consider your scales. There is plenty of literature on the topic, but few definitive answers.

Usability

Usability is a hot topic for online surveys right now. Researchers agree that making surveys clear and engaging is beneficial to gathering good data that supports high quality insights. However, there isn’t all that much agreement on some of the newer approaches. This is a huge area, so here are just a few points for consideration:

  • Shorter surveys are (almost) always better. The longer a survey takes, the less likely it is to yield good results. People drop out before the end or give less thoughtful responses (lie?) just to get through the survey. The only reason for the “almost” qualifier is that sometimes survey administrators send out multiple surveys because they didn’t include some key questions originally. But the reverse is the problem in most cases. Often the survey is overloaded with extra questions that aren’t relevant to the study.
  • Be respectful of the survey taker. Explain what the survey is all about, and why they are helping you. Tell them how long it will take – really! Give them context for where they are, both in the form of textual cues, and also if possible with progress bars (but watch out for confusing progress bars that don’t really reflect reality). Use survey logic and piping to simplify and shorten the survey; if someone says they aren’t using Windows, they probably shouldn’t see questions about System Restore.
  • Take enough time to develop and test questions that are appropriate for the audience and the topic. This isn’t just a matter of using survey logic, but writing the questionnaire correctly in the first place. Although online survey data collection is faster than telephone, it takes longer to develop the questionnaire and test.
  • Gamification of surveys is much talked about, but not usually done well. For a practical, business-oriented survey taker, questions that aren’t as straightforward may be a deterrent. On the other hand, a gaming audience may greatly appreciate a survey that appears more attuned to them. Beyond the scope of this article, some research is being conducted within games themselves.

Reliability

One aspect of reliability is uptime of the server hosting the survey tool. Perhaps more relevant to survey research are matters related to survey and questionnaire design:

  • Representativeness of the sample within the target population is important for quality results, but the target depends on the purpose of the research. If you want to find out if a new version of your product will appeal to a new set of prospects, you can’t just survey customers. An online panel sample is generally regarded as representative of the market.
  • How you invite people to take the survey also affects how representative the sample is. Self selection bias is a common issue; an invitation posted on the website is unlikely to work well for a general survey, but may have some value if you just need to hear from those with problems. Survey invitations via email are generally more representative, but poor writing can destroy the benefit.
  • As well as who you include and how you invite them, the number of participants is important. Assuming other requirements are met, a sample of 400 yields results that are within ±5% at 95% reliability. The confidence interval (±5%) means that the results from the sample will be within that range of the true population’s results. For the numerically oriented, that’s a worst case number, true for a midpoint response; statistical testing takes this into account. The reliability number (95%) means that the results will conform 19 out of 20 times. You can play with the sample size, or accept different levels of confidence and reliability. For example, a business survey may use a sample of 200 (for cost reasons) that yields results that are within ±7% at 95% reliability.
  • Another aspect of reliability comes from the questionnaire design. This is a deep and complex subject, but for now let’s just keep it high-level. Make sure that the question text reflects the object of the question, that the options are exclusive, single thoughts, exhaustive (with don’t know, none of the above, or other/specify as appropriate).

Security

Considerations for survey security are similar to those for general IT security, with a couple of extra twists.

  • Is your data secure on the server? Does your provider (or do you if you are hosting your own surveys) take appropriate precautions to make sure that the data is backed up properly and is guarded against being hacked into?
  • Does the connection between the survey taker and the survey tool need to be protected? Most surveys use HTTP, but SSL capabilities are available for most survey tools.
  • Are you taking the appropriate measures to minimize survey fraud (ballot stuffing?) What’s needed varies with the type of survey and invitation process, but can include cookies, personalized invitations, and password protection.
  • Are you handling the data properly once exported from the survey tool? You need to be concerned with overall data in the same way that the survey tool vendor does. But you also need to look after personally identifiable information (PII) if you are capturing any. You may have PII from the customer list you used for invitations, or you may be asking for this information for a sweepstake. If the survey is for research purposes, ethical standards require that this private information is not misused. ESOMAR’s policy is simple – Market researchers shall never allow personal data they collect in a market research project to be used for any purpose other than market research. This typically means eliminating these fields from the file supplied to the client. If the project has a dual purpose, and the survey taker is offered the opportunity for follow up, this fact must be made clear.

Availability

No longer being involved in engineering, I’d have to scratch my head for the distinction between availability and reliability. But as this is about IT terms as they apply to surveys, let’s just consider making surveys available to the people you want to survey.

  • Be careful about question types that may work well on one platform and not another, or may not be consistently understood by the audience. For example, drag and drop ranking questions look good and have a little extra zing, but are problematic on smart phones. Do you tell the survey taker to try again from a different platform (assuming your tool detects properly), or use a simpler question type? This issue also relates to accessibility (section 508 of the Rehabilitation Act, or the British Disability Discrimination Act). Can a screen reader deal with the question types?
  • Regardless of question types, it is probably important to make sure that your survey is going to look reasonable on different devices and browsers. More and more surveys are being filled out on smartphones and iPads. Take care with fancier look and feel elements that aren’t interoperable across browsers. These days you probably don’t have to worry too much about people who don’t have JavaScript available or turned on, but Flash could still be an issue. For most of the surveys we run, Flash video isn’t needed, and in any case isn’t widely supported on mobile devices. HTML5 or other alternatives are becoming more commonly used.
  • Instead of accessing web surveys from any compatible mobile devices, consider other approaches to surveying. I’m not a proponent of SMS surveys; they are too limited, need multiple transactions, and may cost the survey taker money. But downloaded surveys on iPad or smartphone have their place for situations where the survey taker isn’t connected to the internet.

I hope that these pointers are meaningful for the IT professional, even with the liberties I’ve taken. There is plenty of information As you can tell, just like in the IT world there are reasons to get help from a research professional. Let me know what you think!

Idiosyncratically,

Mike Pritchard

Filed Under: Fun, Methodology, Surveys, SurveyTip

Leave a Comment

Survey Tip: Pay Attention to the Details

Why survey creators need to pay more attention to the details of wording, question types and other matters that not only affect results but also how customers view the company. A recent survey from Sage Software had quite a few issues, and gives me the opportunity to share some pointers.

The survey was for follow up satisfaction after some time with a new version of ACT! Call me a dinosaur, but after experiments with various online services, I still prefer a standalone CRM. Still, this post isn’t really about ACT! – I’m just giving a little background to set the stage.

  • The survey title is ACT! Pro 2012 Customer Satisfaction Survey. Yet one of the questions asks the survey taker to compare ACT 2011 with previous versions. How dumb does this look?
    Image:Survey title doesn't match question
  • This same question has a text box for additional comments. The box is too small to be of much use, but also the box can’t be filled with text. All the text boxes in the survey have the the same problem.
    Image: Comment boxes should be big enough
  • If you have a question that should be multiple choice, set it up correctly.
    Image: Use multiple choice properly
    Some survey tools may use radio buttons for multiple choice (not a good idea), but this isn’t one of them. This question should either be reworded along the lines of “Which of these is the most important social networking site you use“, or – probably better – use a multiple choice question type.
  • Keep up to date.
    Image: Keep up to date with versions
    What happened to Quickbooks 2008, or more recent versions? It would have been better to simply have Quickbooks as an option (none of the other products had versions). If the version of Quickbooks was important (I know that integration with Quickbooks is a focus for Sage) then a follow up with the date/version would work, and would make the main question shorter.
  • There were a couple of questions about importance and performance for various features. I could nitpick the importance question (more explanation about the features or an option something like “I don’t know what this is” would have been nice), but my real issue is with the performance question. 20 different features were included in both importance and performance. That’s a lot to keep in mind, so it’s good to try to make the survey taker’s life easier by keeping the order consistent between importance and performance. The problem was that the order of the performance list didn’t match the first. I thought at first that the lists were both randomized separately, instead of randomizing the first list and using the same order for the second. This is a common mistake, and sometimes the survey software doesn’t support doing it the right way. But after trying the survey again, I discovered the problem was that both lists were fixed orders, different between importance and performance. Be consistent. Note, if your scales are short enough, and if you don’t have a problem with the survey taker adjusting their responses as they think about performance and importance together (that’s a topic of debate among researchers) you might consider showing importance and performance together for each option.
  • Keep up to date – really! The survey asked whether I used a mobile computing device such as a smartphone. But the next question asked about the operating system for the smartphone without including Android. Unbelievable!
    Image: Why not include Android in smart phone OS list?

There were a few other problems that I noted, but they are more related to my knowledge of the product and Sage’s stated directions. But similar issues to those above occur on a wide variety of surveys. Overall, I score this survey 5 out of 10.

These issues make me as a customer wonder about the competence of the people at Sage. A satisfaction survey is designed to learn about customers, but should also create the opportunity to make the customers feel better about the product and the company. However, if you don’t pay attention to the details you may do more harm than good.

Idiosyncratically,

Mike Pritchard

Filed Under: Methodology, Questionnaire, SurveyTip Tagged With: Survey Tips, Surveys

Leave a Comment

Impact of cell phones on 2010 Midterms and beyond politics

Whether you are a political junkie or not, recent articles and analysis about mobile phones as part of data collection should be of interest to those who design or commission survey research. Cost, bias, and predictability are key issues.

In years gone by, cell phone users were rarely included in surveys. There was uncertainty about likely reaction of potential respondents (“why are you calling me on my mobile when I have to pay for incoming calls?”, “is this legal?”). Although even early on surveyors were nervous about introducing bias through not including younger age groups, studies showed that there were only insignificant differences beyond those associated with technology. When cell phone only households were only 7% researchers tended to ignore them. Besides, surveying via cell phone cost more, due to requirements that auto-dialing techniques couldn’t be used, increased rejection rates, compensating survey takers to compensate for their costs, and also a need for additional screening to reduce the likelihood of someone taking the survey from an unsafe place. Pew Research Center’s landmark 2006 study focused on cell phone usage and related attitudes, but also showed that the Hispanic population was more likely to be cell phone only.

Over the course of the next couple of years, Pew conducted several studies (e.g. http://people-press.org/report/391/the-impact-of-cell-onlys-on-public-opinion-polling ) showing that there was little difference in political attitudes between samples using landline only and those using cell phones. At the same time, Pew pointed out that other non-political attitudes and behaviors (such as health risk behaviors) differed between the two groups. They also noted that cell phone only households had reached 14% in December 2007. Furthermore, while acknowledging the impact of cost, Pew studies also commented on the value of including cell phone sampling in order to reach certain segments of the population (low income, younger). What’s Missing from National RDD Surveys? The Impact of the Growing Cell-Only Population.

Time marches on. Not surprisingly give the studies above, for more and more research, cell phone sample is now being included. With cell phone only households now estimated at upwards of 25% this increasingly makes sense. But not apparently for most political polls, despite criticism. The Economist, in an article October 7, 2010, http://www.economist.com/node/17202427 summarizes the issues well. Cost of course is one factor, but this impacts different polling firms and types differently. Pollsters relying on robocalling (O.K. IVR or Interactive Voice Response if you don’t want to associate these types of polls with assuredly partisan phone calls), are particularly affected by cost considerations. Jay Leve of SurveyUSA estimates costs would double for firms to change from automated calling to human interviewers as would be needed to call cell phones. And as the percentage of cell phone only households varies across states, predictability is even less likely. I suspect that much of this is factored into Nate Silver’s assessments on his FiveThirtyEight blog,  but he is also critical of the pollsters for introducing bias (http://fivethirtyeight.blogs.nytimes.com/2010/10/28/robopolls-significantly-more-favorable-to-republicans-than-traditional-surveys/ ). Silver holds Rasmussen up as having a Republican bias due to their methodology, and recently contrasted Rasmussen results here in Washington State with Elway (a local pollster using human interviewers) who has a Democratic bias according to FiveThirtyEight.

I’ve only scratched the surface of the discussion. We are finally seeing some pollsters incorporating cell phones into previously completely automated polls and this trend will inevitably increase as respondents are increasingly difficult to reach via landlines. Perhaps the laws will change to allow automated connections to cell phones, but I don’t see this in the near future given the recent spate of laws to deter use while driving.

But enough of politics. I’m fed up with all the calls (mostly push, only a few surveys) because apparently my VOIP phone still counts as a landline. Still, I look forward to dissecting the impact of cell phones after the dust has settled from November 2nd.

What’s the impact for researchers beyond the political arena?

  • If your survey needs a telephone data collection sample for general population, you’d better consider including cell phone users despite the increased cost. Perhaps you can use a small sample to assess bias or representativeness, but weighting alone will leave unanswered questions without some current or recent data for comparison.
  • Perhaps it’s time to use online data collection for all or part of your sample. Online (whether invitations are conducted through panels, river sampling, or social media) may be a better way to reach most of the cell phone only people. Yes, it’s true that the online population doesn’t completely mirror the overall population, but differences are decreasing and it may not matter much for your specific topic. Recent studies I’ve conducted confirm that online panelists aren’t all higher income, broadband connected, younger people. To be sure, certain groups are less likely to be online, but specialist panels can help with, for example, Hispanic people.

The one thing you can’t do is to ignore the cell phone only households.

By the way, if you are in the Seattle area, you might be interested in joining me at the next Puget Sound Research Forum luncheon on November 18, when REI will present the results of research comparing results from landline, cell phone and online panel sample for projectability.  http://pugetsoundresearchforum.org/

Good luck with your cell phone issues!

Idiosyncratically,

Mike Pritchard

Filed Under: Methodology, News, Published Studies, Surveys Tagged With: News, Published Studies, statistical testing, Statistics

  • Go to page 1
  • Go to page 2
  • Go to page 3
  • Go to Next Page »

Primary Sidebar

Follow us on LinkedIn Subscribe to Blog via RSS Subscribe to Blog via Email
5 Circles Research has been a terrific research partner for our company. Mike combines a wealth of experience in research methodology and analytics with a truly strategic perspective – it’s a unique combination that has helped our company uncover important insights to drive business decisions.
Daniel WiserBrand ManagerAttune Foods Inc.
You know how your mechanic knows what’s wrong with your car when you just tell them what it sounds like over the phone? Well, my first conversation with Mike was like that — in like 10 seconds, he gave me an insight into my market research that was something I’d been struggling trying to figure out. A class like this will help you learn what you can do on your own. And, you’ll have a better idea of what a research vendor can do for you.
Roy LebanFounder and CTOPuzzazz
What we were doing was offering not just a new product, but a new market niche. We needed to understand traditional markets well to characterize the new one. Most valuable was 5 Circles ability to gather research data and synthesize it.
Will NeuhauserPresident Chorus Systems Inc.
I have come to know both Mike and Stefan as creative, thoughtful, and very diligent research consultants. They were always willing to go further to make sure respondents remained engaged and any research results were applicable and of immediate use to us here at Bellevue CE. They were partners and thought leaders on the project. I am happy to recommend them to any public sector client.
Radhika Seshan, Ph.DRadhika Seshan, Ph.D, Executive Director of Programs Continuing Education Bellevue College
Mike did multiple focus groups for me when I was at Amazon, and I was extremely pleased with the results. Not only is Mike an excellent facilitator, he also really understood the business problem and the customer experience challenges, and that got us to excellent and very actionable results.
Werner KoepfSenior ManagerAmazon.com
Mike brings a tremendous balance of theoretical marketing research with a strong practical knowledge of marketing. He can tailor the research to the right level for your project. I have hired Mike multiple times and he has delivered each time. I would hire him again.
Rick DenkerPresidentPacket Plus
Many thanks to you for the very helpful presentation on pricing last night. I found it extremely useful and insightful. Well worth the drive down from Bellingham!
G.FarkasCEOTsuga Engineering
When you work with a market research company you normally have to define the questions. 5 Circles Marketing’s staff have technical backgrounds, so it’s a lot easier to work with them.
Lorie WigleProduct Line Manager, Business Communications DivisionIntel Corporation
Great workshop! You know this field cold, and it’s refreshing to see someone focused on research for entrepreneurs.
Maria RossOwnerRed Slice
First, I thought it was near impossible to obtain good market information without a large scale, complex market study. Working with 5 Circle Research changed that. We were able to put together a comprehensive survey that provided essential information the company was looking for. It started with general questions gradually evolving to specifics in a fast pace, fun to take questionnaire. Introducing “a new way of doing things” like Revollex’ induction heating-susceptor technology can be challenging. The results provided critical data to help understand the market demand. High quality work, regard for schedule, thorough understanding of the issues are just a few aspects of an overall exceptional experience.
Robert PoltCEORevollex.com

Featured Posts

Dutch ovens: paying a lot more means better value

An article on Dutch ovens in the September/October 2018 of Cook’s Illustrated gives food for thought (pun intended) about the relationship of between price and value. Sometimes higher value for a buyer means paying a lot more money – good news for the seller too. Dutch ovens (also known as casseroles or cocottes) are multipurpose, [Read More]

Profiting from customer satisfaction and loyalty research

Business people generally believe that satisfying customers is a good thing, but they don’t necessarily understand the link between satisfaction and profits. [Read More]

Customer satisfaction: little things can make a big difference

Unfulfilled promises by the dealer and Toyota of America deepen customer satisfaction pothole. Toyota of America and my local dealer could learn a few simple lessons about vehicle and customer service. [Read More]

Are you pricing based on cost rather than value? Why?

At Pricing Gurus, we believe that value-based pricing allows companies to achieve higher profitability and a better competitive position. Some companies disagree with that perspective, or feel they are stuck with cost-based pricing. Let’s explore a few reasons why value-based pricing is generally superior. [Read More]

Recent Comments

  • Mike Pritchard on Van Westendorp pricing (the Price Sensitivity Meter)
  • Marshall on Van Westendorp pricing (the Price Sensitivity Meter)
  • 📕 E mail remains to be the most effective SaaS advertising channel; Chilly emails that work for B2B; Figuring out how it is best to worth… - hapidzfadli on Van Westendorp pricing (the Price Sensitivity Meter)
  • Isabelle Spohn on Methow Valley Ski Trails gets pricing right
  • Microsoft Excel Case Study: Van Westendorp-un "Price Sensitivity Meter" modeli | Zen of Analytics on Van Westendorp pricing (the Price Sensitivity Meter)

Categories

  • Overview
  • Contact
  • Website problems or comments
Copyright © 1995 - 2023, 5 Circles Research, All Rights Reserved